On par with nationwide trends, regions in Ontario’s cottage country saw a jump in new listings in May, giving buyers more choices and more leverage as the market continued to approach a place of balance.
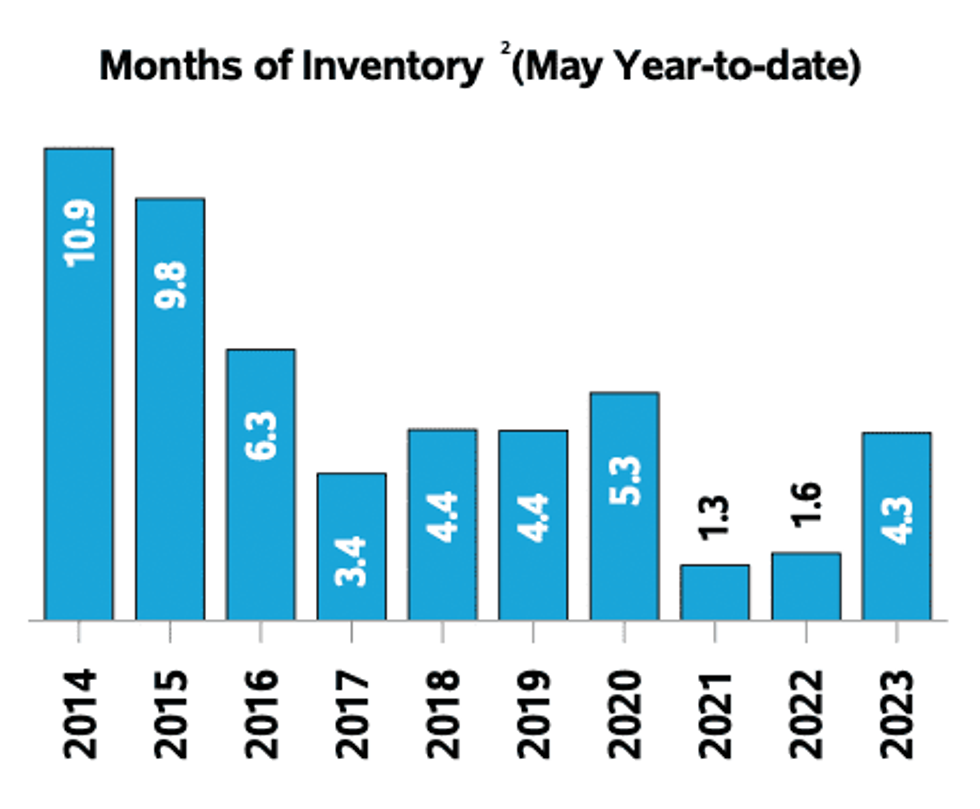
This is according to new figures from the Canadian Real Estate Association (CREA), which shows that, on the whole, Lakelands North — which extends to include cottage country’s crown jewel, Muskoka — saw 595 new residential listings come online in May, representing a year-over-year gain of 6.4%. Active listings took a substantial leap in the month, growing 57.2% to 852. There was also 3.8 months of inventory, up from 2.2 in May 2022.
In terms of sales, 223 properties changed hands, however, that figure was down 10.1% from the same time last year.
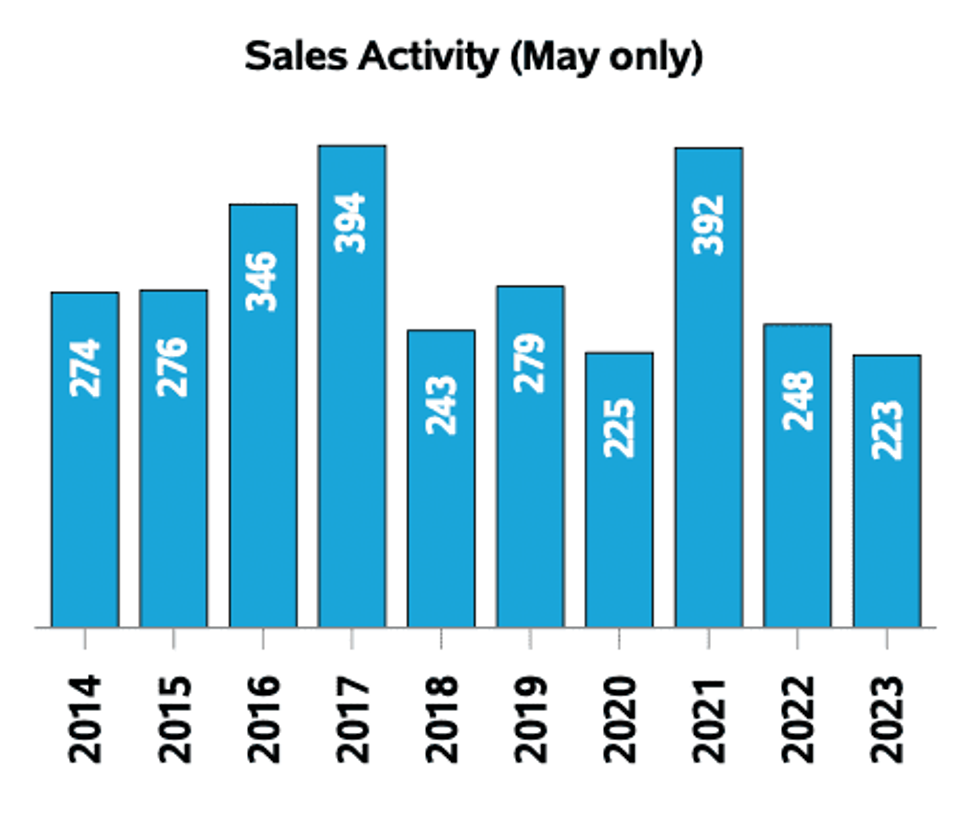
As well, prices edged upwards in May, with the average selling price up 4.7% year over year to $1,120,144. Meanwhile, the median lifted 5.5% to $810,000. Total dollar volume came in at $249,792,208.
Year-to-date, there were 1,552 new residential listings and 533 active listings recorded (up 4.9% and 96.3%, respectively) and 613 properties were sold. That latter figure was down 29.2% from the previous May.
Also year-to-date, the average selling price clocked in at $954,732, while the median price came in at $705,000. Both of those figures were down about 6% from May 2022.
Months of inventory, however, rallied on a year-to-date basis for the second-straight May, rising to 4.3.
For the waterfront market specifically, new listings came in at 339, representing a year-over-year increase of 15.7%, while active listings grew by 59.8% to 513. As well, 106 waterfront properties were sold in the region. That number was down just 7.8% from the year before.
May saw a significant uptick in months of inventory. That metric came in at 4.8 months, well over the 2.8 months recorded in May 2022.
Gains were also recorded with respect to waterfront property prices — average sales price came in at $1,552,351, up 3.7% from the prior May, while the median price edged up 15.8% to $1,100,000 — and those gains were reflected in the monthly trajectory as well.
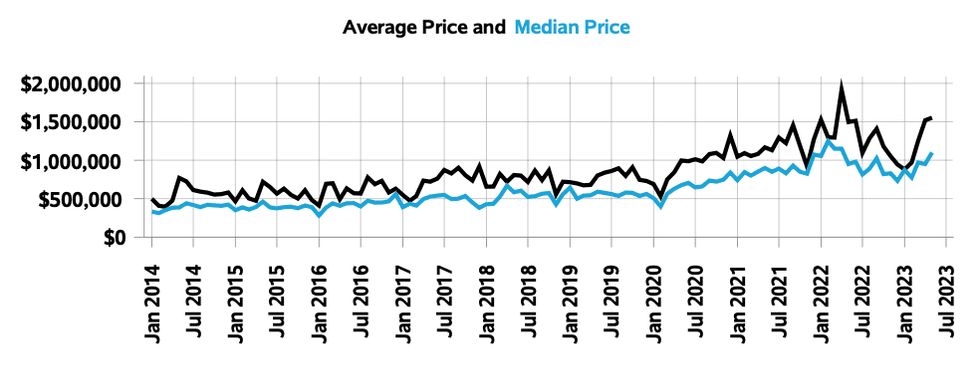
Dollar volume was down slightly (-4.4%) in May in the waterfront segment, with that metric ending up at $164,553,458.
It’s also worth noting that the sale-to-list price ratio for waterfront properties fell to 97.6% in May, marking a decrease of 4.9% from May 2022. That dip puts the ratio at its lowest level since 2020.
A further narrative can be drawn from the year-to-date numbers for the waterfront segment. According to Ross Halloran, Broker and Senior VP of Sales for Halloran & Associates, Sotheby’s International Realty Canada, all signs point to correction.
“The Waterfront Market still appears to be in the midst of a slow correction with both the number of sales and dollar volumes down by 24% and 30% respectively when compared to the year-to-date period at the end of May 2022,” says Halloran. “It appears from the May 2023 results that both sellers and buyers are now proceeding more cautiously when negotiating their sales transactions and sellers seem to be finally getting the message that the historic increase in waterfront property values during 2020 and 2021 heydays of the pandemic are now squarely behind us for the foreseeable future.”
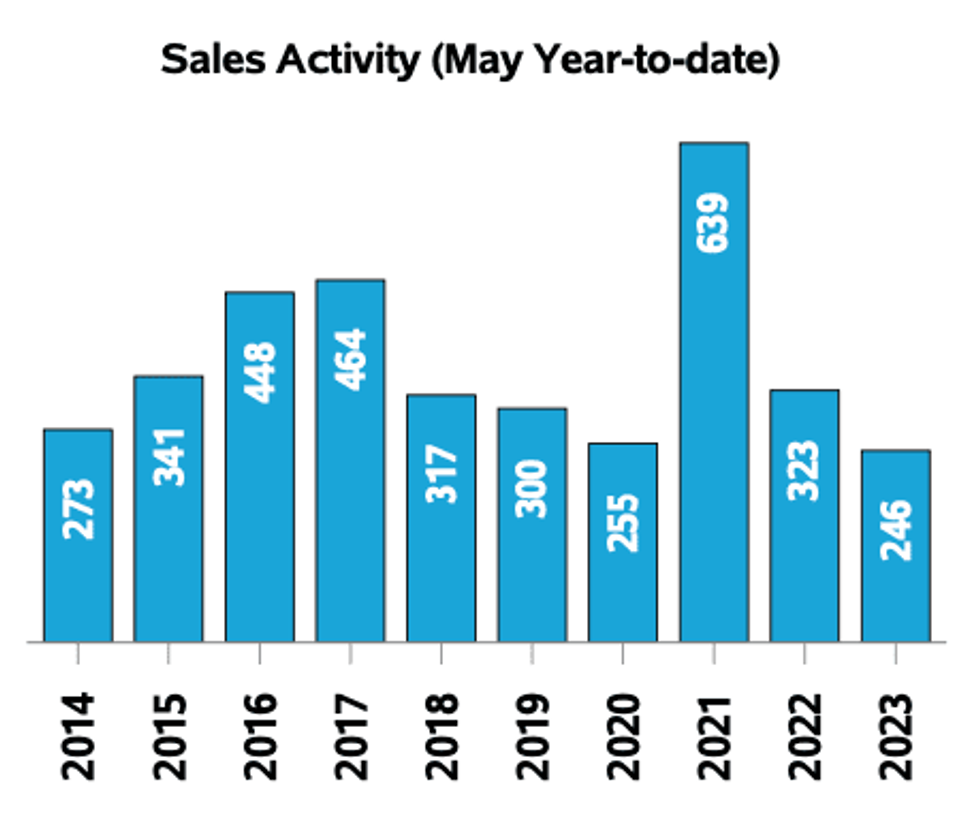
While year-to-date sales of waterfront properties, at 246, clocked in at a decrease last month, the number of active listings was encouraging, coming in at 290, up 85% over the same year-to-date period at the end of May 2022. Year-to-date new waterfront listings also saw a gain, ticking up 14.9% year over year to 777.
Current conditions spell good things for buyers adds Halloran.
“With almost six months of available inventory, buyers finally have more choices as new listings are up year over year by 14.9% and active listings are up 85%,” he says. “Clearly, it is also apparent that buyers are flexing their new found leverage muscles by negotiating average sale prices down year over year by 8% and median prices down by almost 13%.”
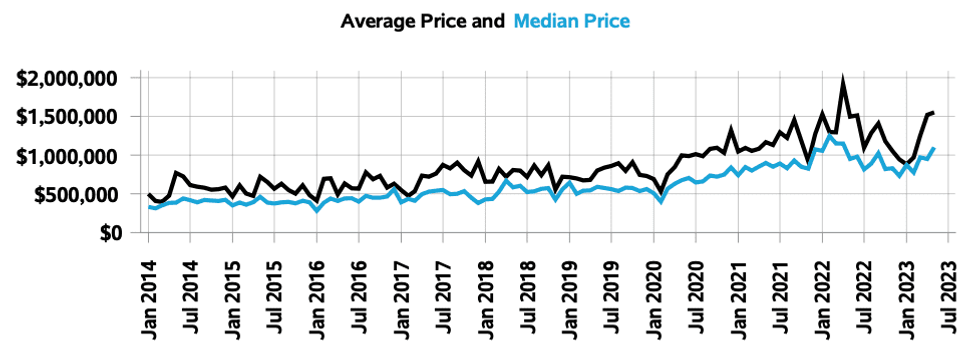
Halloran also draws attention to the year-to-date sale-to-list price ratio, which has fallen to 96.6%, representing a downgrade of 8.4% when compared to what the ratio was at the same point last year. The ratio is now at its lowest level since 2016.
In addition, on a year-to-date basis, the median days on the market edged up to 22 days in May 2023, up from 11 days over the same measure in May 2022.
Still, Halloran’s overall outlook is optimistic.
“Looking ahead to June 2023, I expect positive sales trending to continue to build upon the increased sales activity witnessed during the last two weeks of May driven by hard-fought negotiated sales achieved by newly empowered buyers who continue to hammer away at list-to -sell price ratios at the seller’s expense,” he says. “Looks like karma corrections have a way of leveling the playing field en route to a balanced market down the road.”
Infographics prepared for the Lakelands Association of REALTORS® by the Canadian Real Estate Association
This article was produced in partnership with STOREYS Custom Studio.
